View Menu
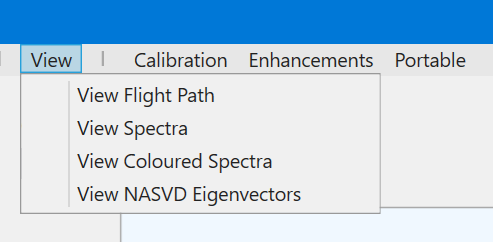
This menu initiates tools to view your data:
- View Flight Path plots the flight path, which can be coloured using any of the single-band fields in the database;
- View Spectra is a tool for viewing the raw or NASVD'd spectra (or a superposition of both);
- View Coloured Spectra gives a view of the spectra in a coloured map format;
- View NASVD Eigenvectors is used for viewing the eigenvectors produced by the NASVD processing.
See Tutorial 2 – Viewing Data for a tutorial on the use of these tools.